The wetlands have always been the awkward corner of the monitoring program. There are nine sites on four water bodies, they are scored on their own band table, and every chapter that meets one adds a caveat and moves on. This chapter is what those caveats say when you put them side by side, which is more than any of them says alone.
The wetland band table is applied to all 224 samples on four factors against a single combined regional-wetland comparison — riffle habitat included, though the bands are edge-derived — and only 208 of them are edge samples with a complete rating. Its bands are the 2012–2015 percentiles of the wetland samples themselves — of which 75% came from six monitoring points on one lagoon — and the network holds exactly one reference wetland. A rating built that way puts the wetlands in order against each other, and it does that honestly. What it cannot do is say whether any of them is in good condition, because there is no outside benchmark in it to be in good condition against. The wetland rating is a ranking, not a condition assessment, and the caveats scattered through the rest of the report are four views of that one fact.
That is not an argument for dropping the wetlands. It is an argument for labelling the number differently, and for three specific fixes: a second reference wetland, wetland-specific water quality ranges, and a decision about the family-richness band that has been carrying a piece of untested ecology since the system was written.
The data behind this chapter
Each question and request below is set out again in What we need from you, with what it blocks, what an answer is worth and what it would cost you to find, ranked against every other ask in the report.
Questions only you can answer
Is there a second wetland anywhere in the LGA — or a neighbouring one — that could serve as a reference site? One more would change what the wetland rating is able to say; two would change it completely.
Ingar Dam is the only ReferenceWetland in the network. A percentile band drawn from a single site cannot support a condition claim, so the wetland rating is a ranking among the nine sites rather than an assessment against wetlands known to be in good shape. This is the structural reason a wetland rating cannot mean what a stream rating means, and it is the only item on this list that would fix it.
Refer to it as dq:wetland-reference-set.
What was behind scoring more than 16 families as a 3 rather than a 5 in wetlands? We have tested it against the Blue Mountains data three ways and cannot find the enrichment it assumes — but if it came from wetlands elsewhere, we have not tested the same claim.
The band is deliberate and documented: a very high family count in a Blue Mountains wetland may indicate excess nutrients. It demotes 33 of the 208 scored edge wetland samples by half a point and moves 6 across the Good/Excellent boundary. Comparing the samples above 16 families with those scoring 5 finds no difference on any of eight water quality indicators; across the whole richness gradient phosphate falls rather than rises; and the tolerant share of individuals does not increase with richness. Our suggestion is to report it as a flag beside the rating instead of folding it into the score — but knowing what the threshold was set from would settle whether that is the right call. The phosphate evidence above is a ratio and a gradient, so it is unaffected by the one thing nobody can pin about that column: whether the readings are phosphate as PO4 or as P, which nothing records and which is worth a factor of three (dq:phosphate-units).
Refer to it as dq:wetland-nonmonotonic-band.
Which point on Glenbrook Lagoon, and which on Wentworth Falls Lake, is the outlet? We have the waterbody polygons and the six lagoon points now share one catchment, but the outlet is inferred as the lowest cell on the polygon rather than known.
Six monitoring points sit on one lagoon and now share a single catchment of 40.5 ha at 25.8% impervious, which is what lets the lagoon into the management priority tables at all. The outlet the catchment drains through is a guess, and moving it moves the catchment. This is a judgement about a lagoon, not something to infer from a flow algorithm, and it is one email.
Refer to it as dq:wetland-outlet-decision.
Which samples went into the wetland band table? We have reconstructed it as the 2012–2015 wetland edge samples, but three quarters of those are the six Glenbrook Lagoon points, and we would like to know whether that is what was intended.
The wetland score is a single combined regional comparison rather than the streams’ urban-plus-reference pair, and its percentiles appear to come from 81 edge samples taken between 2012 and 2015 at nine sites. Sixty-one of those 81 are six monitoring points on Glenbrook Lagoon and ten are the reference wetland. If that is the intended construction it is worth saying so in the methods document, because it determines what an “Excellent” wetland is being compared with.
Refer to it as dq:wetland-band-provenance.
Site 922, the Wentworth Falls Lake jetty, is classified Urban rather than UrbanWetland, so everything grouped by water body type counts a lake as a stream. Can we reclassify it?
It is water-quality-only, so no health rating is affected, but 510 trigger comparisons from 85 water quality samples currently sit in the stream column. Reclassifying it moves the stream turbidity exceedance figure by about 1.7 percentage points on its own. The macroinvertebrate site for the same lake, 24BWF, is classified correctly.
Refer to it as dq:site-922-classification.
The desirable water quality ranges are for streams — are you happy for us to report wetland readings without a benchmark until wetland ranges exist, or would you rather we left them out of the report card entirely?
2,500 of the 15,633 comparisons in the trigger table are wetland samples scored against ranges derived from an Appendix 2 site list of 32 stream sites and two wetlands — a stream distribution with a token of wetland in it, not a wetland benchmark. Keeping them moves the headline “% above the desirable range” by three to seven percentage points for EC, salinity, nitrate-N and turbidity, and the wetland subgroup differs far more than that: 59% of wetland alkalinity readings sit above the stream range against 38% of stream readings, and 34% of wetland phosphate readings against 24%. The analysis filters them out and says so; what to do in the published report card is your call.
Refer to it as dq:wetland-stream-triggers.
Would you like us to derive wetland-specific desirable water quality ranges, the same way the wetland macroinvertebrate bands were derived? It is a day’s work, and it inherits the same one-reference-wetland problem.
There are 644 wetland water quality samples spanning 1998 to 2025, 368 of them carrying at least one of the parameters the desirable ranges cover, which is enough to compute percentiles. What it cannot do is anchor them to wetlands known to be in good condition, so the result would be a wetland ranking on the water quality side to match the one on the macroinvertebrate side. That may still be more useful than comparing lagoon water with a stream range, and it is your call whether it is worth having.
Refer to it as dq:wetland-desirable-ranges.
The wetland family-count column has band 3 ending at 10.99 and band 4 starting at 10.00, so 10.00–10.99 is in two bands. We have read band 4 as starting at 11.00 — can you confirm that is what was meant?
The published column reads “9.0–10.99 or >16” for a score of 3 and “10.00–12.99” for a score of 4. The only reading that makes the column a partition is band 4 beginning at 11.00, and that is what the analysis implements. The methods document’s Wentworth Falls Lake worked example has 12 families, so it does not discriminate between the two readings. It is a typographical defect rather than a conceptual one, but the next person to implement the table could resolve it the other way.
Refer to it as dq:wetland-band-overlap.
What would answer them
Would you be able to run two or three edge samples at candidate reference wetlands over one season? That is the smallest piece of new fieldwork that would change what the wetland rating can say.
A regional wetland reference set does not need to be large to be transformative here, because the current set is one site. Three wetlands sampled twice each would give a benchmark distribution to score against and would let the wetlands be rated the way the streams are, rather than only ranked against each other. If NPWS or a neighbouring council already sample wetlands to a comparable protocol, their data would do the same job for nothing.
Refer to it as dq:wetland-reference-survey.
Nine sites, six of them the same lagoon
Read Table 11.1 as a list of water bodies rather than sites and there are four: Glenbrook Lagoon (six points), Wentworth Falls Lake (one bug site, plus the water-quality-only site 922), Ingar Dam and one swampy reach of Adams Creek. Ingar Dam is the reference wetland. So the wetland program is four water bodies, one of them a benchmark.
224 macroinvertebrate samples have been taken at them between 1998 and 2024. 15 are recorded as Riffle habitat — a riffle in a lagoon is almost certainly a habitat code entered out of habit, and in any case riffle samples are scored against edge-derived bands, so they are held out of everything below that reads a rating (209 remain). Just one of those is unrated — sample 750 at Glenbrook Lagoon in 2018 found a single taxon, which is too few to average four factor scores over, and it used to be published as Very Poor on the strength of it — which leaves the 208 scored samples every rating below is read off.
The data layer already knows this. Its band_applicable flag is false for exactly those 15 samples and true for all 209 others: the record that the bands do not apply has been sitting beside every riffle sample the whole time, and the published rating scores them regardless. The objection this chapter makes at length is, in the data, one column that was already being ignored.
Why the rating is a ranking
A stream sample is scored on four factors twice — once against other Blue Mountains urban sites and once against the reference sites — and the eight scores averaged. A wetland sample is scored on the same four factors once, against a single combined regional-wetland comparison. That is the whole difference in the methods document, and it sounds like a simplification. It is not. The second stream comparison is what carries the condition claim: a stream is measured against creeks known to be in good shape, so “Excellent” means “like a reference creek”. There is no such column for wetlands.
There could not be. The bands were set from the 81 edge wetland samples taken between 2012 and 2015, at nine sites, of which 61 (75%) are the six Glenbrook Lagoon points and 10 are the reference wetland. Three quarters of the distribution the wetland rating is graded against is one urban lagoon. So a wetland scoring 5 on family richness is, in substance, a wetland unlike Glenbrook Lagoon; and the reference wetland contributes about one sample in eight to the benchmark it is supposed to anchor.
The consequence shows up in the ratings themselves.
In Table 11.2, 36% of scored wetland samples are rated Excellent, against 15% of stream samples. Wentworth Falls Lake — an urban lake with a beach, in the middle of a town, in a catchment 18.5% impervious — is rated Excellent in 73% of its 33 scored samples. Whether that is right or not is not the point: the rating has no way of telling us, because the only thing the lake is being compared with is the other eight wetland sites, six of which are one lagoon.
None of this is a mistake in the arithmetic. The bands are implemented exactly as published and the data layer reproduces the methods document’s Wentworth Falls Lake worked example. It is a limit on what the number can mean, and it follows from having one reference wetland. Until there is a regional wetland reference set, the honest label for a wetland score is a within-Blue-Mountains ranking, and the two-anchor construction the streams use cannot be extended to wetlands at all (dq:wetland-reference-set).
The family-richness band, tested
Score 3 on the wetland family-richness column reads “9.0–10.99 or more than 16”. The rationale is in a footnote to the published table: in Blue Mountains wetlands a very high family count may indicate excess nutrients, so a high-richness sample is not credited as if it were a good one. That is a real piece of ecology — enrichment does raise richness in a lot of shallow standing water — and it is the only place in either band table where scoring is deliberately non-monotonic.
It is also doing more work than a footnote suggests. 33 of the 208 scored wetland samples (16%) sit above 16 families and are demoted by it, each losing exactly 0.50 points off the average factor score; 6 of them cross the Good / Excellent boundary as a result. So it changes a published rating for about one wetland sample in 35.
It has never been tested. There are now enough wetland samples to test it, and this section does.
What the band asserts, and how to check it
The claim is that a wetland sample with more than 16 families is, on average, more nutrient-enriched than one with 13–16 families — because 13–16 is the band that scores 5, and the two are what the rule separates. That is directly checkable against the water quality record, which the rating does not use.
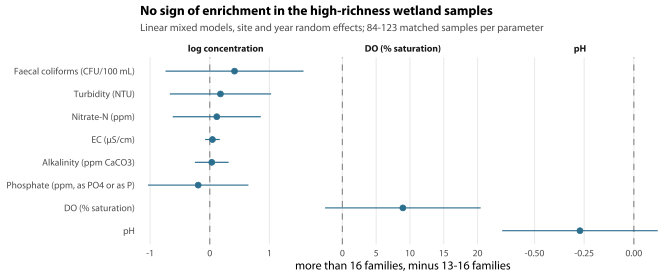
Every wetland macroinvertebrate sample with a usable matched water quality record goes in: 123 samples from 9 sites over 24 years, of which 27 have more than 16 families and 23 have 13–16. Each parameter is modelled with random intercepts for site and for year, so the comparison is made within sites and within years — otherwise it would only be saying that Ingar Dam differs from Glenbrook Lagoon, which we knew. Within-site richness varies by four to six families at every site, so there is real variation to work with.
⚠ Phosphate’s species is unconfirmed, and it is worth knowing that before the figure. Nothing in either database or the methods document says whether the readings are phosphate as PO4 or as P, and the two differ by a factor of three (Section 7.5, dq:phosphate-units). Every phosphate figure in this chapter is a ratio, a percentage change or a censored share of that one column, so the ambiguity cancels out of all of them and none of the conclusions here turns on it. What it does mean is that the phosphate row label in the tables and figures below is not a complete description of the quantity, in a way that nitrate-N’s is.
Not one of the eight indicators separates the two groups. Phosphate is ×0.82 (95% CI ×0.35 to ×1.91) in the high-richness group — that is, lower, though the interval spans a threefold difference either way. Nitrate-N is ×1.12 (95% CI ×0.54 to ×2.35), alkalinity ×1.03 (95% CI ×0.78 to ×1.37) and electrical conductivity ×1.05 (95% CI ×0.92 to ×1.18). Dissolved oxygen saturation is 8.9 points higher in the high-richness group (95% CI -2.6 to 20.5), which is the direction that argues against enrichment rather than for it, and it too is indistinguishable from no difference.
Be careful how much that null is asked to carry. With 27 samples on one side and 23 on the other, the phosphate comparison could only have detected something like a doubling of concentration. So this is not a demonstration that the two groups are alike; it is a demonstration that no difference large enough to justify a half-point penalty has shown itself in 24 years of matched sampling.
The gradient says something stronger
The contrast above throws away most of the data by cutting richness into two groups — 50 of the 123 matched samples. Fitting richness as a gradient keeps all 123 in play and is much better powered, though each parameter is still fitted only on the samples that carry a reading for it: 84 to 123, in the n column of Table 11.3.
Phosphate falls by 7.8% for each extra family (95% CI 2.3% to 13%) on 88 samples. That is the opposite of what the band assumes, and phosphate is the nutrient the enrichment argument rests on.
Phosphate is also the parameter where censoring bites hardest — 40 of 88 readings are laboratory zeros — so it is worth two further checks. Among the readings where phosphate was actually detected the slope is -8.7% per family (95% CI -15% to -1.9%); and modelling detection as a yes/no outcome gives 0.88 times the odds of a detection per extra family (95% CI 0.77 to 1.01) — fewer detections at higher richness, not more. All three treatments of the censoring point the same way.
Electrical conductivity is the one indicator that moves the way the band expects — 1.5% per family (95% CI 0.5% to 2.4%), or about 42% across the whole observed richness range of 3 to 27 families. It is a real gradient; it is also not a nutrient, and it is not what the band’s footnote claims. pH falls a little as well. Everything else in Table 11.3 is flat.
Fitting both at once — a linear richness term and a step at 16 families on top of it — leaves the step indistinguishable from zero on all 6 concentrations, the widest estimate being +0.92 on the log scale. There is nothing happening at 16 families that the gradient does not already describe.
There is a third check that needs no water quality data at all, and it has the largest sample of the three. If high richness in a wetland were enrichment, the extra families should be tolerant ones. Across all 208 edge wetland samples the tolerant share of individuals changes by -0.5 percentage points per extra family (95% CI -1.3 to 0.3), and mean SIGNAL-SF changes by +0.016 (95% CI -0.006 to 0.038) — flat on both. Richer wetland samples here are not richer because tolerant families have moved in.
That interval is narrow for a reason worth stating, though, because it is the same reason as in Section 11.6: 57% of these samples are the six Glenbrook Lagoon points. Drop that one water body and the sign reverses, to +1.0 percentage points per family (-0.1 to 2.1, on 90 samples at three sites) — and across the roughly 24-family span of richness here, that upper bound would be about 50.5 percentage points of tolerant individuals, which is the enrichment signature rather than a refutation of it. So the flat result is largely one lagoon, the other three water bodies point the other way, and this leg is suggestive rather than decisive.
What we would say about the band
The band’s ecology is sound in general and does not appear to be what is happening in these nine wetlands. On the direct contrast the evidence is a well-behaved null with honest limits; on the gradient it points the other way; on the community composition it is flat overall, and that leg is mostly one lagoon. Taken together, three tests give no support for scoring more than 16 families as a 3, and one of them mildly contradicts it.
The immediate suggestion is small: the judgement is worth keeping, but not inside the score. Fold it out into a separate flag — “family richness above the range expected for an unenriched Blue Mountains wetland” — reported next to the rating rather than averaged into it. That keeps the ecological warning where a reader can see it, and it stops a wetland with 16 families and one with 20 receiving scores that cannot be told apart afterwards. It also makes the band monotonic, which matters for chapter 16’s test protocol, and it removes 6 unexplained Good ratings.
One question is genuinely for the team rather than for the data: what evidence the 16-family threshold was set from in the first place (dq:wetland-nonmonotonic-band). If it came from wetlands outside the Blue Mountains, this chapter has not tested the same claim.
The overlap in the published table
The wetland # families column reads 9.0–10.99 (or >16) for a score of 3 and 10.00–12.99 for a score of 4. The stated range for score 4 overlaps score 3, so 10.00–10.99 belongs to two bands at once. Since band 3 ends at 10.99, the only reading that makes the column a partition is that band 4 begins at 11.00, and that is what is implemented here (wetland_families_band4_lower = 11.00). The published Wentworth Falls Lake worked example (12 families) does not discriminate between the two readings, so the document provides no evidence either way. It is a typographical defect rather than a conceptual one, and worth correcting in the next revision so nobody re-implements it the other way (dq:wetland-band-overlap).
Stream ranges, wetland water
2,500 of the 15,633 comparisons in wq_trigger_flags are wetland samples — 368 distinct water quality samples, taken between 1998 and 2025. The methods document is explicit that its Table 1 gives desirable ranges for BM streams, and the Appendix 2 site list those percentiles come from is 32 stream sites and two wetlands — 28EHZR and 12GMB — so the ranges are a stream distribution with a token of wetland in it, not a wetland benchmark. The wetland rows in wq_trigger_flags are retained and flagged by trigger_applicable; the report card chapter filters them out, and says so.
It is not a cosmetic distinction. Leaving the wetlands in moves the headline “% above the desirable range” by three to seven percentage points on four parameters, and the wetland subgroup differs from the stream one by far more than that.
In Table 11.4, 59% of wetland alkalinity readings sit above the stream range against 38% of stream readings, and 34% of wetland phosphate readings against 24%. Both are what you would expect — standing water accumulates what running water carries away — and neither is a statement about wetland condition, because there is no wetland range to compare them with. Deriving wetland-specific desirable ranges, the same way the wetland macroinvertebrate bands were derived, is the natural next step, and it runs into exactly the same problem: one reference wetland (dq:wetland-desirable-ranges).
One classification to fix while you are there. Site 922 (Wentworth Falls Lake — Jetty) is a jetty on a lake, but it is classified Urban rather than UrbanWetland, so waterbody_type reads “stream” and its 510 comparisons from 85 water quality samples are counted as stream readings. It is water-quality-only, so no health rating is affected; but any analysis grouped by water body type has a lake in the stream column, and reclassifying it moves the stream turbidity figure by 1.7 percentage points on its own. The macroinvertebrate site for the same lake is 24BWF, which is classified correctly (dq:site-922-classification).
The recovery does not reach the wetlands
208 edge wetland samples from 9 sites are held out of the community analysis in chapters 8 and 9, because a wetland community is a different community rather than a degraded stream one, and including them makes the first ordination axis a wetland-versus-stream axis and little else. They are too few to carry the full analysis, but the same headline measure can be computed on the same matrix: the sensitive share of individuals in wetland samples changes by -7.2 percentage points per decade (95% CI -13.7 to -0.7), against +9.4 (6.1 to 12.7) in streams.
The wetlands may be moving the other way. The sensitive share is falling there while it rises in the creeks, and this is the only place in the whole record where the recovery signal is absent. But read the sample honestly before reading the interval: it is 9 monitoring points on four water bodies, and 118 of the 208 samples are six points on Glenbrook Lagoon. A site random effect treats those six as six independent wetlands.
Take the water body as the unit instead — one series per water body per year, 76 rows — and the estimate is -4.4 percentage points per decade (-10.9 to 2.2). Leaving one water body out at a time gives -10.7, -7.0, -2.8, -5.8, and 3 of the 4 intervals cross zero. The point estimate is negative under every specification we tried; the interval only excludes zero when the six Glenbrook Lagoon points are counted as six independent sites. So the direction is worth chapter 9 looking at properly, and the detection is not something to build on.
There is a composition confound worth naming too. The panel shifts toward the urban lagoon over the record: Glenbrook Lagoon supplies 55% of the samples in the earlier half and 59% in the later half. Some of a falling sensitive share is the mix of water bodies changing rather than any one of them changing.
The rating itself shows nothing either way. The average factor score at the wetlands changes by -0.03 points per decade (95% CI -0.28 to 0.21) across 208 samples at 9 sites. That is an absence of detectable change, not evidence of stability: the standard error is 0.12, so a real trend would have had to be about 0.35 score points per decade — 0.91 points over the 26-year record, or 91% of a whole rating class — before this design would reliably have caught it. Between-site variation dominates (site SD 1.11 against a residual of 0.64), which is what nine sites on four water bodies buys you.
The two results are not in conflict. The composition measure uses every individual counted and is far better powered than a four-factor average of banded scores; it is the more sensitive instrument, and it is the one showing movement. A wetland rating that cannot see a change the underlying counts can see is a further reason not to read it as a condition assessment.
Chapter 6’s water quality trends exclude the wetlands for the same reason: only 113 Macro wetland samples carry measurements, too few for a parallel trend analysis, and wetland water is chemically distinct from stream water in any case.
The catchments
The six Glenbrook Lagoon monitoring points share one catchment (40.5 ha, 25.8% impervious, the figure repeated down Table 11.1), keyed on the mapped waterbody polygon and drained through a single inferred outlet. Wentworth Falls Lake is handled the same way and covers both 24BWF and site 922. With a defensible imperviousness figure, Glenbrook Lagoon can go into the management tables chapter 17 builds.
Two different ranges travel with that percentage and they are not interchangeable. The published figure comes from the street-and-address method, which assumes what fraction of a road corridor is sealed (0.45) and how much impervious area an address point carries (250 m²). Moving both of those to their extremes together — 0.35 to 0.55, and 180 to 330 m² — gives 21.8–32.1%. That is an assumption range and not a confidence interval. Nothing in it is estimated from a sample, there is no replication and no variance anywhere in the construction, so it has no coverage probability of any kind; and because both constants move together it is a max–min box rather than an interval on either one. The data layer calls it a sensitivity range and this chapter now calls it that too.
The honest measure of how uncertain the figure is comes from somewhere else — the three methods disagreeing with each other on the same catchment. Land-use classes give 37.0%, mesh blocks 30.8% and street-and-address 25.8%, a spread of 25.8% to 37.0%. That spread is wider than the assumption range, though by less than a percentage point, and the assumption range still does not contain it: it reaches above its top. The land-use estimate sits above the top of the band this chapter used to publish as a 95% interval — 37.0% against 32.1% — while the sweep’s lower limit of 21.8% is below anything any of the three methods returns. Width is not what is wrong with the sweep; coverage is. Moving the two constants to their extremes traces out a band of about the right size in the wrong place, so it neither brackets the methods nor substitutes for their disagreement. So a reader who wants a range around Glenbrook Lagoon’s imperviousness should take 25.8–37.0%, and should read 25.8% as the choice of one defensible method rather than as a precise figure. Section 4.3.7 retires the modelled connected index on the ground that method choice matters more than the modelling does; this is the same argument arriving at the label.
The outlet itself is still inferred rather than known. The algorithm takes the lowest point on the waterbody polygon, which is a reasonable guess and not a fact, and getting it wrong moves the catchment. This is a judgement about a lagoon rather than something to read off a flow algorithm, and it is one email (dq:wetland-outlet-decision).
What we can and cannot say
What you might want to think about
- Relabel the wetland score. Call it a within-Blue-Mountains wetland ranking wherever it is published. It costs nothing, it is accurate, and it stops the number being read as a condition assessment by someone who was not in the room when it was built.
- Find a second reference wetland, and ideally a third. This is the one change that would let the wetlands be assessed the way the streams are. Ingar Dam cannot anchor a percentile band on its own, and everything else in this chapter follows from that.
- Take the family-richness judgement out of the score and put it beside the score. A flag reading “richness above the range expected for an unenriched Blue Mountains wetland” keeps the ecology and stops 16% of wetland samples being silently demoted on a rationale the data do not support.
- Correct the 10.00–10.99 overlap in the published family band, so the next person to implement it does not resolve it the other way.
- Derive wetland desirable ranges — or say plainly in the report card that the wetland readings are shown without a benchmark. Either is fine; showing them against stream ranges without a note is not.
- Reclassify site
922 as UrbanWetland, or exclude it from anything grouped by water body type.
- Tell us where Glenbrook Lagoon and Wentworth Falls Lake drain, so the shared catchments rest on your knowledge rather than on the lowest cell in a polygon.
This chapter is a first look at the wetland sites in their own right, and two parts of that job are still missing: a wetland-specific band derivation, which needs the reference set, and a proper look at why the sensitive share is falling, which belongs with the community work in chapter 9.